Case Study in Human Contexts and Ethics
Note: Given the nuanced nature of some of the arguments made in the lecture, it is highly recommended that you view the lecture recording given by Professor Ari Edmundson to fully engage and understand the material. The course notes will have the same broader structure but are by no means comprehensive.
Disclaimer: The following note discusses issues of structural racism. Some of the items in this note may be sensitive and may or may not be the opinions, ideas, and beliefs of the students who collected the materials. The Data 100 course staff tries its best to only present information that is relevant for teaching the lessons at hand.
As data scientists, our goal is to wrangle data, recognize patterns and use them to make predictions within a certain context. However, it is often easy to abstract data away from its original context. In previous lectures, we’ve explored datasets like elections, babynames, and world_bank to learn fundamental techniques for working with data, but rarely do we stop to ask questions like “How/when was this data collected?” or “Are there any inherent biases in the data that could affect results?”. It turns out that inquiries like these profoundly affect how data scientists approach a task and convey their findings. This lecture explores these ethical dilemmas through the lens of a case study.
Let’s immerse ourselves in the real-world story of data scientists working for an organization called the Cook County Assessor’s Office (CCAO) located in Chicago, Illinois. Their job is to estimate the values of houses in order to assign property taxes. This is because the tax burden in this area is determined by the estimated value of a house rather than its price. Since value changes over time and has no obvious indicators, the CCAO created a model to estimate the values of houses. In this note, we will dig deep into biases that arose in the model, the consequences to human lives, and what we can learn from this example to avoid the same mistakes in the future.
The Problem
What prompted the formation of the CCAO and led to the development of this model? In 2017, an investigative report by the Chicago Tribune uncovered a major scandal in the property assessment system managed by the CCAO under the watch of former County Assessor Joseph Berrios. Working with experts from the University of Chicago, the Chicago Tribune journalists found that the CCAO’s model for estimating house value perpetuated a highly regressive tax system that disproportionately burdened African-American and Latinx homeowners in Cook County. How did the journalists demonstrate this disparity?
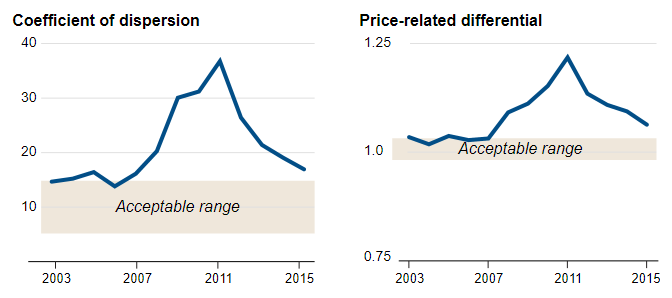
The image above shows two standard metrics to estimate the fairness of assessments: the coefficient of dispersion and price-related differential. How they’re calculated is out of scope for this class, but you can assume that these metrics have been rigorously tested by experts in the field and are a good indication of fairness. As we see above, calculating these metrics for the Cook County prices revealed that the pricing created by the CCAO did not fall in acceptable ranges. While this on its own is not the entire story, it was a good indicator that something fishy was going on.
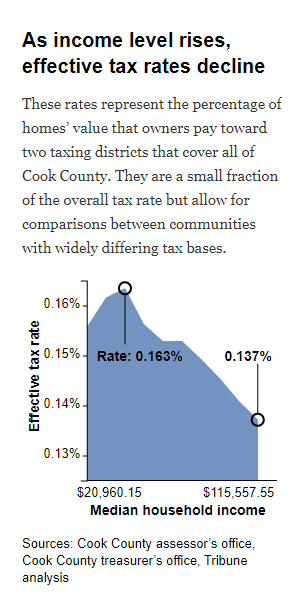
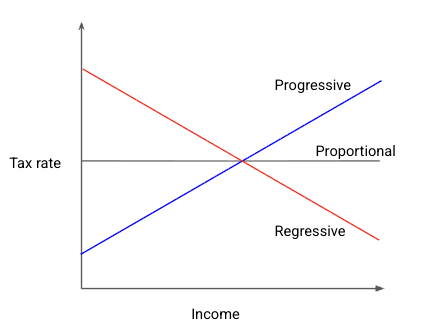
This prompted journalists to investigate if the CCAO’s model itself was producing fair tax rates. When accounting for the homeowner’s income, they found that the model actually produced a regressive tax rate (see figure above). A tax rate is regressive if the percentage tax rate is higher for individuals with lower net income; it is progressive if the percentage tax rate is higher for individuals with higher net income. The figure below shows a simple representation of progressive and regressive tax rate.
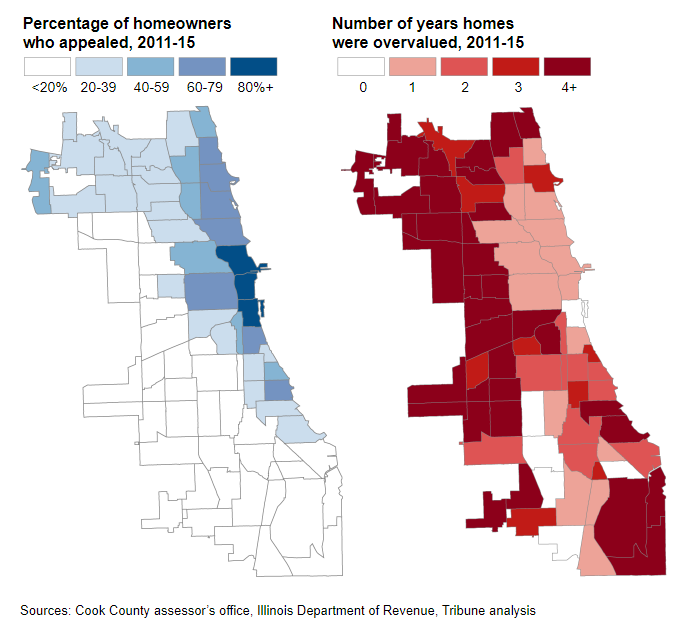
Digging further, journalists found that the model was not only regressive and unfair to lower-income individuals, but it was also unfair to non-white homeowners (see figure below).
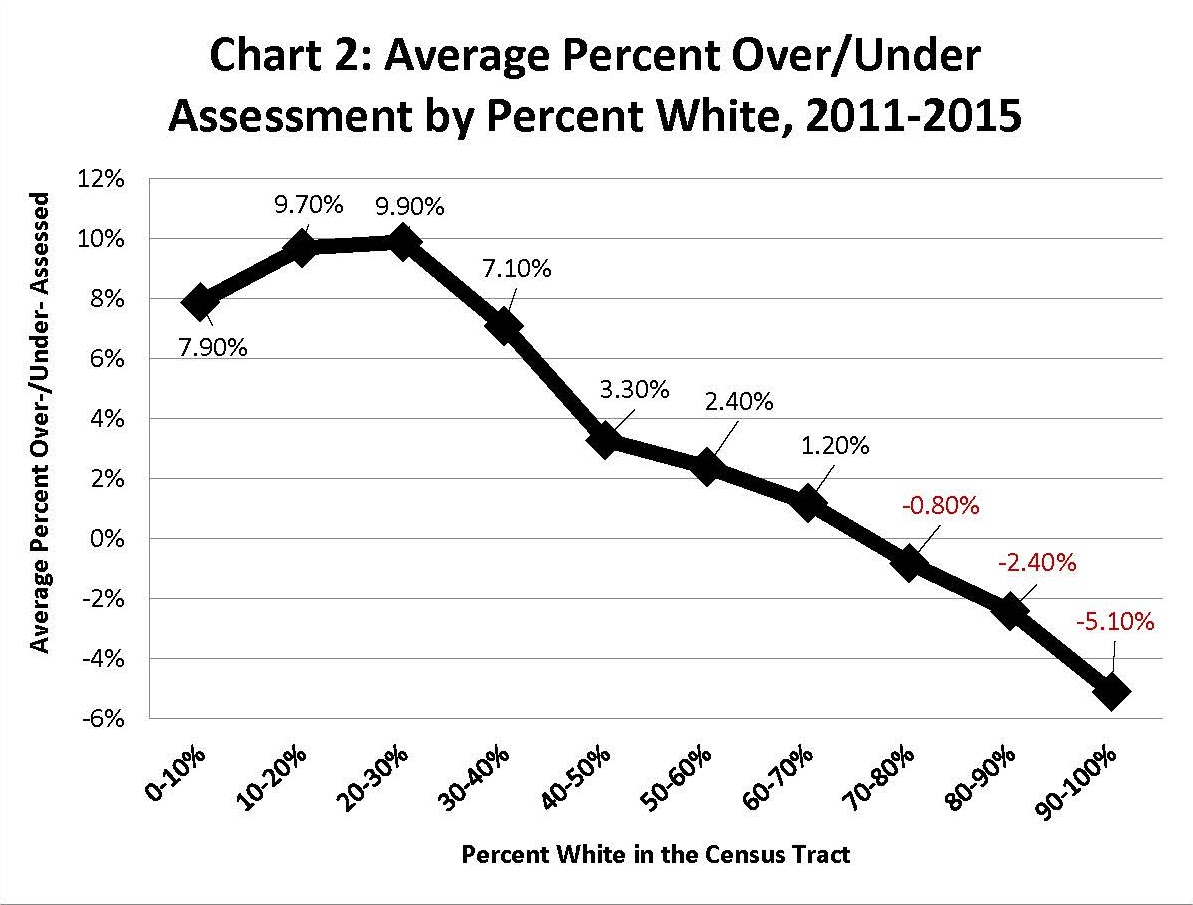
The likelihood of a property being under- or over-assessed was highly dependent on the owner’s race, and that did not sit well with many homeowners.
Spotlight: Appeals
What was the cause of such a major issue? It might be easy to simply blame “biased” algorithms, but the main issue was not a faulty model. Instead, it was largely due to the appeals system which enabled the wealthy and privileged to more easily and successfully challenge their assessments. Once given the CCAO model’s initial assessment of their home’s value, homeowners could choose to appeal to a board of elected officials to try and change the listed value of their home and, consequently, how much they are taxed. In theory, this sounds like a very fair system: a human being oversees the final pricing of houses rather than a computer algorithm. In reality, this ended up exacerbating the problem.
“Appeals are a good thing,” Thomas Jaconetty, deputy assessor for valuation and appeals, said in an interview. “The goal here is fairness. We made the numbers. We can change them.”
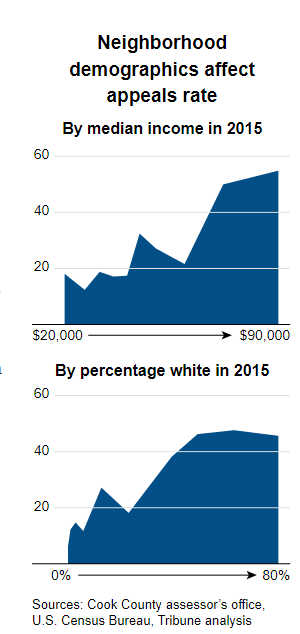
We can borrow lessons from Critical Race Theory —— on the surface, everyone has the legal right to try and appeal the value of their home. However, not everyone has an equal ability to do so. Those who have the money to hire tax lawyers to appeal for them have a drastically higher chance of trying and succeeding in their appeal (see above figure). Many homeowners who appealed were generally under-assessed compared to homeowners who did not (see figure below). Clearly, the model is part of a deeper institutional pattern rife with potential corruption.
In fact, Chicago boasts a large and thriving tax attorney industry dedicated precisely to appealing property assessments, reflected in the growing number of appeals in Cook County in the 21st century. Given wealthier, whiter neighborhoods typically have greater access to lawyers, they often appealed more and won reductions far more often than their less wealthy neighbors. In other words, those with higher incomes pay less in property tax, tax lawyers can grow their business due to their role in appeals, and politicians are socially connected to the aforementioned tax lawyers and wealthy homeowners. All these stakeholders have reasons to advertise the appeals system as an integral part of a fair system; after all, it serves to benefit them. Here lies the value in asking questions: a system that seems fair on the surface may, in reality, be unfair upon taking a closer look.
Human Impacts
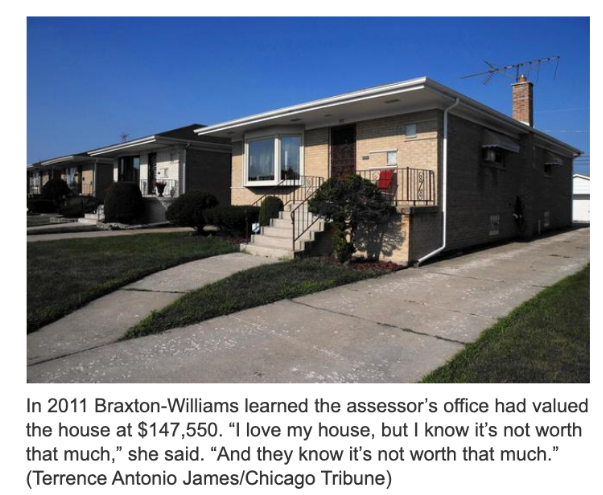
What happened as a result of this corrupt system? As the Chicago Tribune reported, many African American and Latino homeowners purchased homes only to find their houses were later appraised at levels far higher than what they paid. As a result, homeowners were now responsible for paying significantly more in taxes every year than initially budgeted, putting them at risk of not being able to afford their homes and losing them.
The impact of the housing model extends beyond the realm of home ownership and taxation —— the issues of justice go much deeper. This model perpetrated much older patterns of racially discriminatory practices in Chicago and across the United States. Unfortunately, it is no accident that this happened in Chicago, one of the most segregated cities in the United States (source). These factors are central to informing us, as data scientists, about what is at stake.
The Response: Cook County Open Data Initiative
The response to this problem started in politics. A new assessor, Fritz Kaegi, was elected and created a new mandate with two goals:
- Distributional equity in property taxation, meaning that properties of the same value are treated alike during assessments.
- Creating a new Office of Data Science.
He wanted to not only create a more accurate algorithmic model but also to design a new system to address the problems with the CCAO.
Let’s frame this problem through the lens of the data science lifecycle.
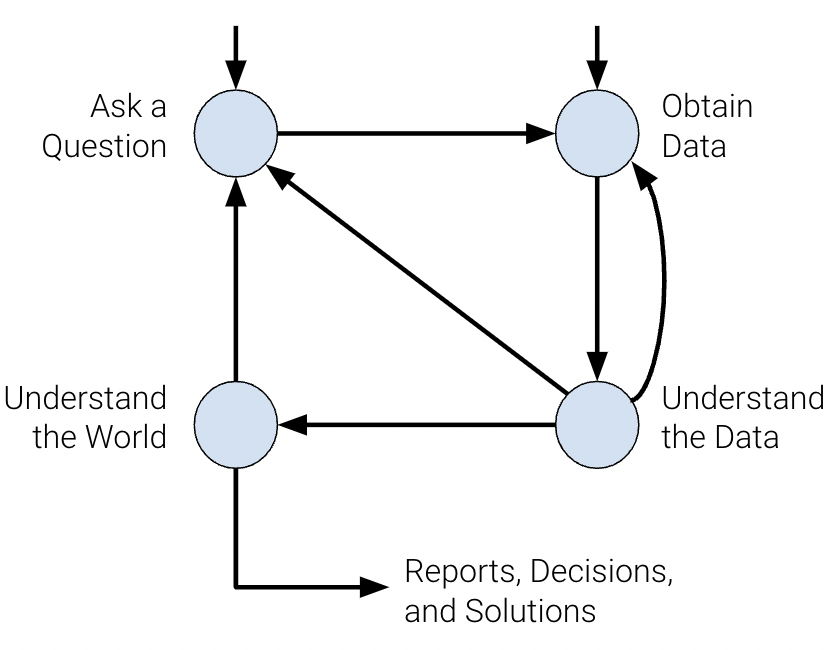
1. Question/Problem Formulation
The old system was unfair because it was systemically inaccurate; it made one kind of error for one group, and another kind of error for another. Its goal was to “create a robust pipeline that accurately assesses property values at scale and is fair”, and in turn, they defined fairness as accuracy: “the ability of our pipeline to accurately assess all residential property values, accounting for disparities in geography, information, etc.” Thus, the plan — make the system more fair — was already framed in terms of a task appropriate to a data scientist: make the assessments more accurate (or more precisely, minimize errors in a particular way).
The idea here is that if the model is more accurate it will also (perhaps necessarily) become more fair, which is a big assumption. There are, in a sense, two different problems — make accurate assessments, and make a fair system. Treating these two problems as one makes it a more straightforward issue that can be solved technically (with a good model) but does raise the question of if fairness and accuracy are one and the same.
For now, let’s just talk about the technical part of this — accuracy. For you, the data scientist, this part might feel more comfortable. We can determine some metrics of success and frame a social problem as a data science problem.
The new Office of Data Science started by framing the problem and redefining their goals. They determined that they needed to:
- Accurately, uniformly, and impartially assess the value of a home and accurately predict the sale price of a home within the next year by:
- Following international standards (e.g., coefficient of dispersion)
- Predicting the value of all homes with as little total error as possible
- Create a robust pipeline that accurately assesses property values at scale and is fair to all people by:
- Disrupting the circuit of corruption (Board of Review appeals process)
- Eliminating regressivity
- Engendering trust in the system among all stakeholders
The goals defined above lead us to ask the question: what does it actually mean to accurately assess property values, and what role does “scale” play?
- What is an assessment of a home’s value?
- What makes one assessment more accurate than another?
- What makes one batch of assessments more accurate than another batch?
Each of the above questions leads to a slew of more questions. Considering just the first question, one answer could be that an assessment is an estimate of the value of a home. This leads to more inquiries: what is the value of a home? What determines it? How do we know? For this class, we take it to be the house’s market value, or how much it would sell for.
Unfortunately, if you are the county assessor, it becomes hard to determine property values with this definition. After all, you can’t make everyone sell their house every year. And as many properties haven’t been sold in decades, every year that passes makes that previous sale less reliable as an indicator.
So how would one generate reliable estimates? You’re probably thinking, well, with data about homes and their sale prices you can probably predict the value of a property reliably. Even if you’re not a data scientist, you might know there are websites like Zillow and RedFin that estimate what properties would sell for and constantly update them. They don’t know the value, but they estimate them. How do you think they do this? Let’s start with the data —— which is the next step in the lifecycle.
2. Data Acquisition and Cleaning
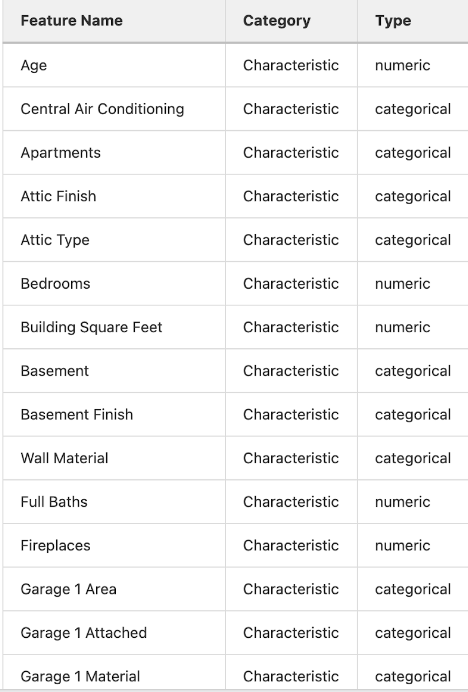
To generate estimates, the data scientists used two datasets. The first contained all recorded sales data from 2013 to 2019. The second contained property characteristics, including a property identification number and physical characteristics (e.g., age, bedroom, baths, square feet, neighborhood, site desirability, etc.).
As they examined the datasets, they asked the questions:
- How was this data collected?
- When was this data collected?
- Who collected this data?
- For what purposes was the data collected?
- How and why were particular categories created?
With so much data available, data scientists worked to see how all the different data points correlated with each other and with the sales prices. By discovering patterns in datasets containing known sale prices and characteristics of similar and nearby properties, training a model on this data, and applying it to all the properties without sales data, it was now possible to create a linear model that could predict the sale price (“fair market value”) of unsold properties.
Some other key questions data scientists asked about the data were:
- Are any attributes of a house differentially reported? How might these attributes be differentially reported?
- How are “improvements” like renovations tracked and updated?
- Which data is missing, and for which neighborhoods or populations is it missing?
- What other data sources or attributes might be valuable?
Attributes can have different likelihoods of appearing in the data. For example, housing data in the floodplain geographic region of Chicago were less represented than other regions.
Features can also be reported at different rates. Improvements in homes, which tend to increase property value, were unlikely to be reported by the homeowners.
Additionally, they found that there was simply more missing data in lower-income neighborhoods.
3. Exploratory Data Analysis
Before the modeling step, they investigated a multitude of crucial questions:
- Which attributes are most predictive of sales price?
- Is the data uniformly distributed?
- Do all neighborhoods have recent data? Do all neighborhoods have the same granularity?
- Do some neighborhoods have missing or outdated data?
They found that certain features, such as bedroom number, were much more useful in determining house value for certain neighborhoods than for others. This informed them that different models should be used depending on the neighborhood.
They also noticed that low-income neighborhoods had disproportionately spottier data. This informed them that they needed to develop new data collection practices - including finding new sources of data.
4. Prediction and Inference
Rather than using a singular model to predict sale prices (“fair market value”) of unsold properties, the CCAO predicts sale prices using machine learning models that discover patterns in data sets containing known sale prices and characteristics of similar and nearby properties. It uses different model weights for each neighborhood.
Compared to traditional mass appraisal, the CCAO’s new approach is more granular and more sensitive to neighborhood variations.
But how do we know if an assessment is accurate? We can see how our model performs when predicting the sales prices of properties it wasn’t trained on! We can then evaluate how “close” our estimate was to the actual sales price, using Root Mean Square Error (RMSE). However, is RMSE a good proxy for fairness in this context?
Broad metrics of error like RMSE can be limiting when evaluating the “fairness” of a property appraisal system. RMSE does not tell us anything about the distribution of errors, whether the errors are positive or negative, and the relative size of the errors. It does not tell us anything about the regressivity of the model, instead just giving a rough measure of our model’s overall error.
Even with a low RMSE, we can’t guarantee a fair model. The error we see (no matter how small) may be a result of our model overvaluing less expensive homes and undervaluing more expensive homes.
Regarding accuracy, it’s important to ask what makes a batch of assessments better or more accurate than another batch of assessments. The value of a home that a model predicts is relational. It’s a product of the interaction of social and technical elements so property assessment involves social trust.
Why should any particular individual believe that the model is accurate for their property? Why should any individual trust the model?
To foster public trust, the CCAO focuses on “transparency”, putting data, models, and the pipeline onto GitLab. By doing so, they can better equate the production of “accurate assessments” with “fairness”.
Another aspect to consider when translating fairness into accuracy is how fairness and accuracy is experienced. The experience of being over-assessed and under-assessed is different depending on who you are. For example, a wealthy home-owner being over-assesed is more likely an inconvenience, as opposed to a lower income home-owner where being over-assessed might mean losing a home. Numbers alone can’t tell you that.
Simply trying to optimize for metrics of accuracy isn’t enough. We must also consider the real-life social impacts and harms from the perspectives of those who encounter them. In this sense a system that errs on the side of overvaluing high value homes and errs on the side of undervaluing lower value homes might be deemed as more fair, even if this means reducing the overall accuracy of the model.
There’s a lot more to be said here on the relationship between accuracy, fairness, and metrics we tend to use when evaluating our models. Given the nuanced nature of the argument, it is recommended you view the corresponding lecture as the course notes are not as comprehensive for this portion of the lecture.
5. Results and Conclusions
Unfortunately, it may be naive to hope that a more accurate and transparent algorithm will translate into more fair outcomes in practice. Even if our model is perfectly optimized according to the standards of fairness we’ve set, there is no guarantee that people will actually pay their expected share of taxes as determined by the model. While it is a good step in the right direction, maintaining a level of social trust is key to ensuring people pay their fair share.
Despite all their best efforts, the CCAO is still struggling to create fair assessments and engender trust.
Stories like the one show that total taxes for residential properties went up overall (because commercial taxes went down). But looking at the distribution, we can see that the biggest increases occurred in wealthy neighborhoods, and the biggest decreases occurred in poorer, predominantly Black neighborhoods. So maybe there was some success after all?
However, it’ll ultimately be hard to overcome the propensity of the board of review to reduce the tax burden of the rich, preventing the CCAO from creating a truly fair system. This is in part because there are many cases where the model makes big, frustrating mistakes. In some cases like this one, it is due to spotty data.
Key Takeaways
So far, we’ve been asking the following questions:
- Under what conditions can data science solve a social problem?
- Under what conditions can a detour through abstractions (numbers, data, models) bring about social change?
In the specific case of Cook County housing, we ask the following questions:
- How does accuracy contribute to making a system more or less fair?
- Under what conditions does accuracy become equivalent to fairness?
Accuracy is not one, simple thing. Fairness is not one, simple thing.
When evaluating the accuracy and fairness of your model:
- Think about the model as part of a larger system.
- Pay attention to the underlying distribution of social power.
- Consider the concrete impacts the system has on different identities, and on people differently positioned in society.
- The same mathematical error doesn’t have the same impact on everyone!
Accuracy isn’t “neutral”: Trying to make accuracy equivalent to fairness is always a political act.
- It involves commitment to a particular and contestable vision of a good social order. This means prioritizing some interests over others.
Improving accuracy doesn’t necessarily bring about fairness.
- The numbers don’t “speak” for themselves.
- Making accuracy equate to fairness is a rhetorical act that might fail to persuade (homeowners, voters, members of the review board) and engender social trust.
Lessons for Data Science Practice: Questions to Consider
Question/Problem Formulation
- Who is responsible for framing the problem?
- Who are the stakeholders? How are they involved in the problem framing?
- What do you bring to the table? How does your positionality affect your understanding of the problem?
- What are the narratives that you’re tapping into?
Data Acquisition and Cleaning
- Where does the data come from?
- Who collected it? For what purpose?
- What kinds of collecting and recording systems and techniques were used?
- How has this data been used in the past?
- What restrictions are there on access to the data, and what enables you to have access?
Exploratory Data Analysis & Visualization
- What kind of personal or group identities have become salient in this data?
- Which variables became salient, and what kinds of relationships do we see between them?
- Do any of the relationships made visible lend themselves to arguments that might be potentially harmful to a particular community?
Prediction and Inference
- What does the prediction or inference do in the world?
- Are the results useful for the intended purposes?
- Are there benchmarks to compare the results?
- How are your predictions and inferences dependent upon the larger system in which your model works?