14 Case Study in Human Contexts and Ethics
The following chapter discusses issues of structural racism. Some of the items in the chapter may be sensitive and may or may not reflect the opinions, ideas, and beliefs of course staff who collected the materials. Please reach out to your GSI or the instructors if you have any concerns or questions about the content that follows.
With thanks to guest lecturer Ari Edmundson.
Let’s immerse ourselves in the real-world story of data scientists working for an organization called the Cook County Assessor’s Office (CCAO). Their job is to estimate the values of houses in Cook County, Illinois, in order to determine property taxation rates. This is because the property tax burden (the amount of tax to be paid by a homeowner) in this area is determined by the estimated value of a house. The homeowner of a house that is higher in value will have to pay more property tax than the homeowner of a house that is lower in value.
In the eyes of the CCAO, a house’s “value” may differ from its price on the housing market, which is why assessment of properties is necessary. Additionally, some homes may have never been listed on the housing market before, so they have no established “sale price.” Since values change over time and there is no obvious indicators of value, the CCAO created a model to estimate the values of houses. In this lecture, we will dig deep into issues of biases encoded into this model, the consequences for human lives, and how we can learn from this example to do better.
14.1 The Problem
A 2017 report by the Chicago Tribune uncovered a major scandal. The team showed that the model perpetuated a highly regressive tax system which disproportionately burdened Black and Latinx homeowners in Cook County.
To understand the implications of a regressive tax system for these communities, we’ll first consider some background.
In the field of housing assessment, assessors often use two metrics to estimate the fairness of assessments: the coefficient of dispersion and the price-related differential. The details of these metrics are out of scope for Data 100, but you can think of them as methods of measuring the “consistency” with which an assessor assigns values to properties. Investigators found that the property valuations performed by the CCAO did not fall into acceptable ranges.
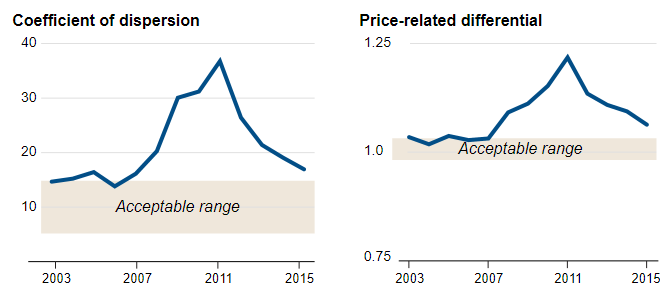
This by itself was not the end of the story, but was an indicator that something fishy was going on.
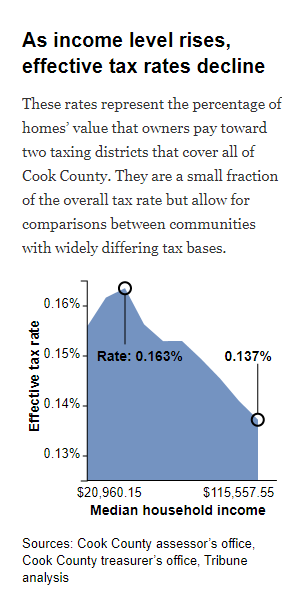
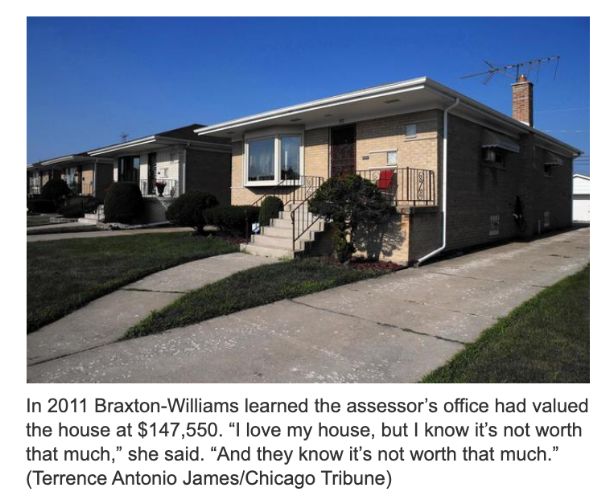
This finding prompted the investigative team to assess if the model designed by the CCAO was outputting fair tax rates. After accounting for the income level of the property homeowner, they found that the CCAO’s model was producing a regressive tax system. Properties owned by low-income homeowners were being overvalued, which meant that these homeowners had to pay property taxes at a rate higher than the true worth of their homes.
Regressive: A tax rate is regressive if the percentage tax rate is higher for individuals with lower net income.
Progressive: A tax rate is progressive if the percentage tax rate is higher for individuals with higher net income.
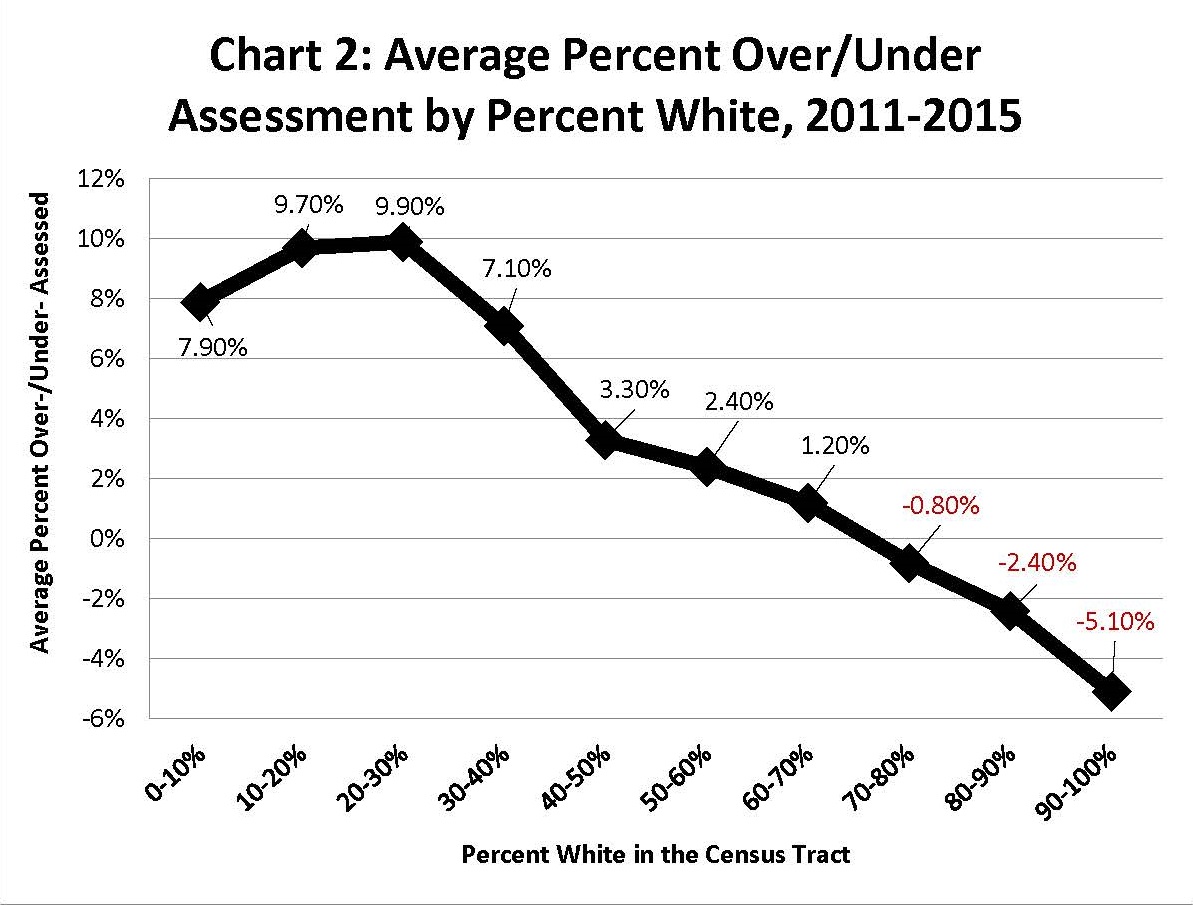
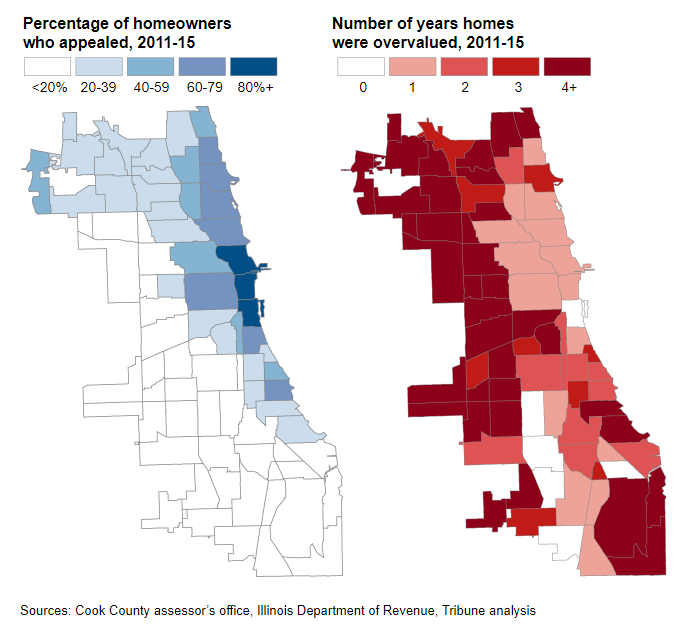
Digging even deeper into the model revealed that the system was not only unfair to homeowners across the axis of income (impacting high-income and low-income communities in different ways), but also unfair over the axis of race. As demonstrated in the figure below, there seemed to be a relationship between a homeowner’s race and the property value assigned by the CCAO model. Houses in regions with predominantly white homeowners tended to be undervalued, meaning that these homeowners had to pay property tax lower than the true worth of their homes.
14.1.1 Spotlight: Appeals
What was the origin of these disparities in the assessment scheme? The answer is a lot bigger than just the CCAO’s model. At the end of the day, these are real social systems that have a lot of moving parts.
One of those moving parts was the appeals system. After the CCAO has performed an assessment, they mail the assessed home value to the homeowner of the property. The homeowner can then choose to appeal this assessment value to a board of elected officials in an attempt to change the final property value, and, thus, how much they will be taxed. In theory, this sounds like a very fair system: there is a human that oversees the final pricing of houses rather than just an algorithm. However, it ended up exacerbating the problems.
“Appeals are a good thing,” Thomas Jaconetty, deputy assessor for valuation and appeals, said in an interview. “The goal here is fairness. We made the numbers. We can change them.”
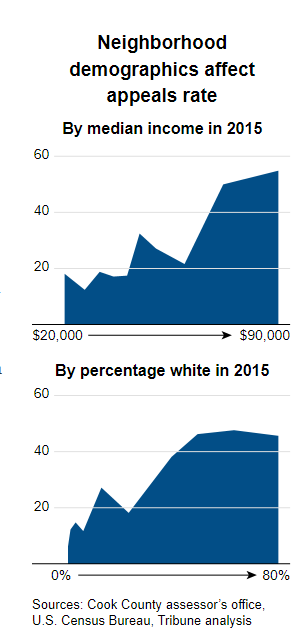
On the surface, it’s undeniable that everyone should have the legal right to appeal the assessment decision. However, the current state of the legal system means that not everyone has an equal ability to launch an appeal. Those who have the money to hire tax lawyers to appeal the assessment on their behalf have a drastically higher chance of succeeding in their appeal. This model is part of a deeper institutional pattern rife with potential corruption.
Homeowners who appealed were generally under-assessed relative to other homeowners, meaning that their property tax rate was low relative to the true value of their homes. This meant that high-income homeowners ultimately paid proportionately less in property tax. It also meant that tax lawyers were able to grow their businesses due to their growing roles in the appeals process. In Cook County, politicians often shared social connections with both these tax lawyers and the wealthy homeowners they served.
All these stakeholders – high-income homeowners, tax lawyers, and some politicians – therefore had reasons to advertise the CCAO model as being an integral part of a fair assessment system.
Here lies the value in asking questions. A system that seems fair on the surface may, in actuality, be unfair upon taking a closer look.
14.1.2 Human Impacts
The impact of the housing model extends beyond the realm of home ownership and taxation. Discriminatory practices have a long history within the United States, and the model served to perpetuate this fact. To this day, Chicago is one of the most segregated cities in the United States (source). These factors are central to informing us, as data scientists, about what is at stake.
14.1.3 Spotlight: Intersection of Real Estate and Race
Housing has been a persistent source and manifestation of racial inequality throughout US history. It is one of the most visible areas where inequalities are created and reproduced. In the early 20th century, Jim Crow laws were explicit in systematically excluding people of color from housing opportunities equal to those made available to white communities.
Today, while advancements in civil rights have been made, the ongoing impacts of these laws are tangible in many parts of the US. One legacy of the Jim Crow era is housing segregation born from discriminatory practices in the real estate industry. The real estate industry, guided by almost exclusively white leaders, was “professionalized” in the 1920’s and 1930’s by aspiring to become a science guided by strict methods and principles. One of these principles was known as redlining. Redlining involved making it difficult, if not impossible, to get a federally-backed mortgage to buy a house in specific neighborhoods coded as “risky.” Often, neighborhoods were identified as “risky” based on their racial composition. In doing so, the real estate industry attempted to create “objective” rating systems for property assessments that encoded race as a factor in valuations.
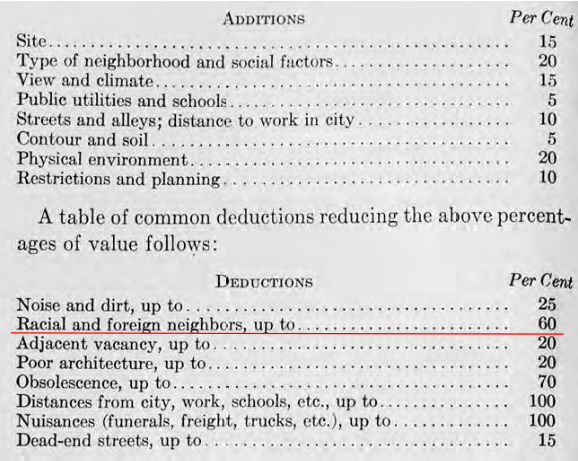
Source: Colin Koopman, How We Became Our Data (2019) p. 137
The result was that people of color tended to purchase and own homes in areas far from where white homeowners resided. This housing segregation is still present in many communities across the US today, including in Cook County.
14.2 The Response: Cook County Open Data Initiative
The response to the injustices uncovered by the investigative team started in politics. A new CCAO assessor, Fritz Kaegi, was elected. He created a new mandate with two goals:

- Distributional equity in property taxation: properties of same value should be treated alike during assessments
- Insitute a new Office of Data Science to address the biases of the existing CCAO model
Let’s consider the work of data scientists in the new CCAO Office of Data Science through the lens of the data science lifecycle.
14.2.1 Question/Problem Formulation
- What do we want to know?
- What problems are we trying to solve?
- What are the hypotheses we want to test?
- What are our metrics for success?
After performing similar reflections, the new Office of Data Science started their work by redefining their goals.
Accurately, uniformly, and impartially assess the value of a home.
- Following international standards (coefficient of dispersion)
- Predicting value of all homes with as little total error as possible.
Create a system that assesses house values that is fair to all people, across perceived racial and income differences.
- Disrupts the circuit of corruption (Board of Review appeals process)
- Eliminates regressivity
- Engenders trust in the system among all stakeholders
Fairness: The ability of the modeling pipeline to accurately assess property values, accounting for disparities in geography, information, etc.
Transparency: The ability of the data science department to share and explain pipeline results and decisions to both internal and external stakeholders
14.2.2 Data Acquisition and Cleaning
- What data do we have and what data do we need?
- How will we sample more data?
- Is our data representative of the population we want to study?
The CCAO data scientists then critically examined the housing data available to them. This is the very same housing data that you will work with in Projects A1 and A2.
- How was this data collected?
- When was this data collected?
- Who collected this data?
- For what purposes was the data collected?
- How and why were particular categories created?
They found that some housing types were less represented than others in the data used to train the original CCAO model. For example, properties located in the floodplains of Chicago were under-represented relative to other regions in Cook County. Certain features were also recorded at different rates. Improvements in homes, which tend to increase property value, were unlikely to be reported by the homeowners.
Notably, they found that there was simply more missing data in lower income neighborhoods.
14.2.3 Exploratory Data Analysis
- How is our data organized and what does it contain?
- Do we already have relevant data?
- What are the biases, anomalies, or other issues with the data?
- How do we transform the data to enable effective analysis?
Before beginning to formulate new models, the data scientists considered a number of important exploratory questions.
- Which attributes are most predictive of sales price?
- Is the data uniformly distributed?
- Do all neighborhoods have up-to-date data? Do all neighborhoods have the same granularity?
- Do some neighborhoods have missing or outdated data?
They found that the impact of certain features, such as the number of bedrooms in a home, were much more impactful in determining house value for properties in certain neighborhoods than they were in other neighborhoods. This suggested that different models should be applied for different neighborhoods.
They also noticed that low income neighborhoods had data with disproportionately many missing values. This informed them that they needed to develop new data collection practices – including finding new sources of data.
14.2.4 Prediction and Inference
- What does the data say about the world?
- Does it answer our questions or accurately solve the problem?
- How robust are our conclusions and can we trust the predictions?
Rather than using a singular model to predict the sale prices (“fair market value”) of unsold properties, the CCAO fit machine learning models that discover patterns using known sale prices and characteristics of similar and nearby properties. It uses different model weights for each township.
Compared to traditional mass appraisal, the CCAO’s new approach is more granular and more sensitive to neighborhood variations.
You can explore the CCAO dataset and models for yourself via their GitLab.
14.2.5 Reports Decisions, and Conclusions
- How successful is the system for each goal?
- Was the new approach able to achieve accuracy/uniformity of the model?
- Has this system instituted fairness and transparency that eliminates regressivity and engenders trust?
- How do you know?
The model is not the end of the road. The new Office of Data Science still sends homeowners their house evaluations, but now the data that they get sent back from the homeowners is taken into account when refining the model. More detailed reports are being written by the office itself to democratize the information. Town halls and other public facing outreach help to ensure that the whole community is involved in the process of housing evaluations, rather than limiting participation to a select few.
14.3 Key Takeaways
Accuracy is a necessary, but not sufficient, condition of a fair system.
Fairness and transparency are context-dependent and sociotechnical concepts
Learn to work with contexts, and consider how your data analysis will reshape them
Keep in mind the power, and limits, of data analysis
14.4 Lessons for Data Science Practice
Question/Problem formulation
- Who is responsible for framing the problem?
- Who are the stakeholders? How are they involved in the problem framing?
- What do you bring to the table? How does your positionality affect your understanding of the problem?
- What are the narratives that you’re tapping into?
Data Acquisition and Cleaning
- Where does the data come from?
- Who collected it? For what purpose?
- What kinds of collecting and recording systems and techniques were used?
- How has this data been used in the past?
- What restrictions are there on access to the data, and what enables you to have access?
Exploratory Data Analysis & Visualization
- What kind of personal or group identities have become salient in this data?
- Which variables became salient, and what kinds of relationship obtain between them?
- Do any of the relationships made visible lend themselves to arguments that might be potentially harmful to a particular community?
Prediction and Inference
- What does the prediction or inference do in the world?
- Are the results useful for the intended purposes?
- Are there benchmarks to compare the results?
- How are your predictions and inferences dependent upon the larger system in which your model works?
Reports, Decisions, and Solutions
- How do we know if we have accomplished our goals?
- How does your work fit in the broader literature?
- Where does your work agree or disagree with the status quo?
- Do your conclusions make sense?