Project A2 Common Questions
Questions 5d and 5f
General Debugging Tips
Question 5 is a challenging question that mirrors a lot of data science work in the real world: cleaning, exploring, and transforming data; fitting a model, working with a pre-defined pipeline and evaluating your model’s performance. Here are some general debugging tips to make the process easier:
- Separate small tasks into helper functions, especially if you will execute them multiple times. For example, a helper function that one-hot encodes a categorical variable may be helpful as you could perform it on multiple such columns. If you’re parsing a column with RegEx, it also might be a good idea to separate it to a helper function. This allows you to verify that you’re not making errors in these small tasks and prevents unknown bugs from appearing.
- Feel free to make new cells to play with the data! As long as you delete them afterward, it will not affect the autograder.
- The
feature_engine_finalfunction looks daunting at first, but start small. First, try and implement a model with a single feature to get familiar with how the pipeline works, then slowly experiment with adding one feature at a time and see how that affects your training RMSE.
My training RMSE is low, but my validation/test RMSE is high
Your model is likely overfitting to the training data and does not generalize to the test set. Recall the bias-variance tradeoff discussed in lecture. As you add more features and make your model more complex, it is expected that your training error will decrease. Your validation and test error may also decrease initially, but if your model is too complex, you end up with high validation and test RMSE.
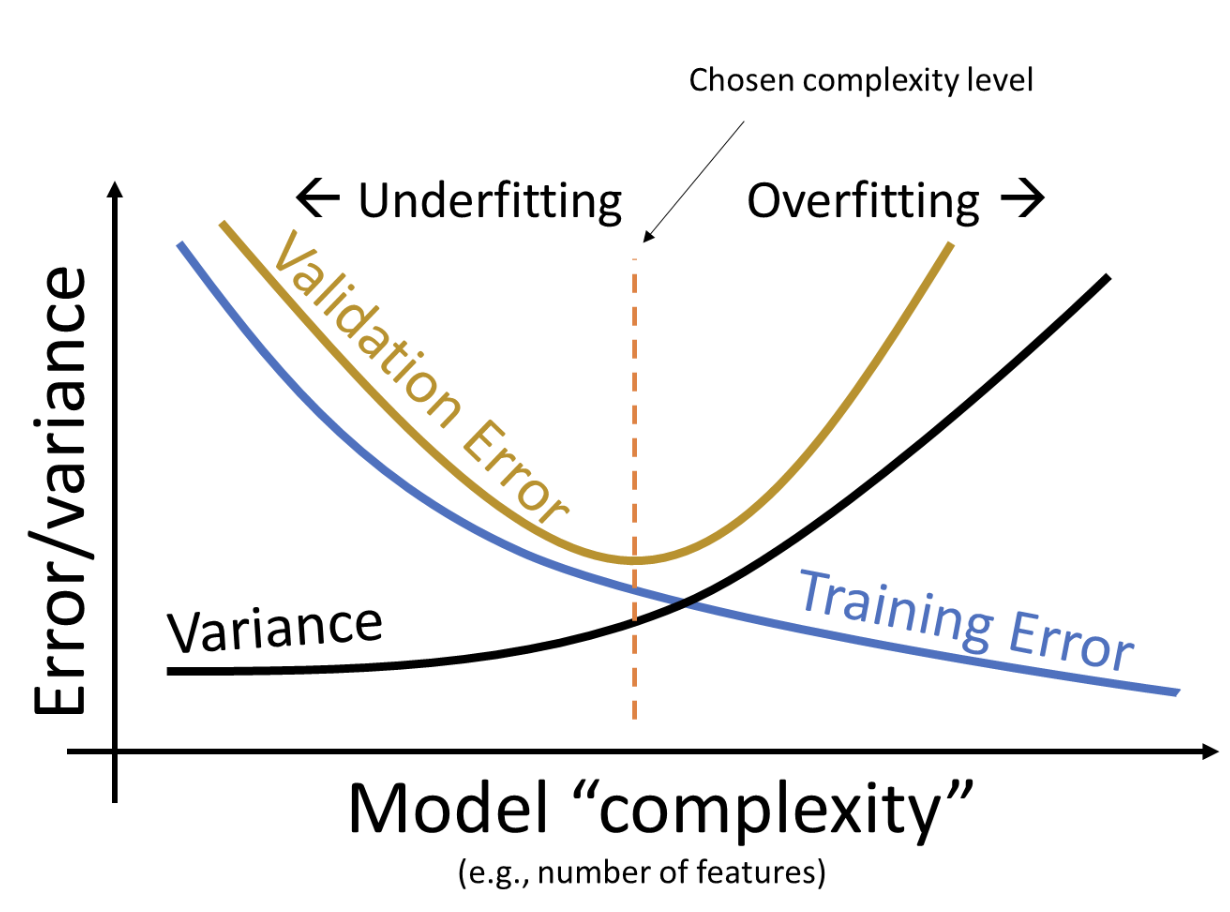
To decrease model complexity, consider visualizing the relationship between the features you’ve chosen with the (Log) Sale Price and removing features that are not highly correlated. Removing outliers can also help your model generalize better and prevent it from fitting to noise in the data. Methods like cross-validation allow you to get a better sense of where you lie along the validation error curve. Feel free to take a look at the code used in Lecture 16 if you’re confused on how to implement cross-validation.
ValueError: Per-column arrays must each be 1-dimensional
If you’re passing the tests for question 5d but getting this error in question 5f, then your Y variable is likely a DataFrame, not a Series. sklearn models like LinearRegression expect X to be a 2D datatype (ie. DataFrame, 2D NumPy array) and Y to be a 1D datatype (ie. Series, 1D NumPy array).
KeyError: 'Sale Price'/KeyError: 'Log Sale Price'
KeyErrors are raised when a column name does not exist in your DataFrame. You could be getting this error because:
- The test set does not contain a
"(Log) Sale Price"as that’s what we’re trying to predict. Make sure you only reference the"(Log) Sale Price"column when working with training data (is_test_set=False). - You dropped the
"Sale Price"column twice in your preprocessing code.
Value Error: could not convert string to float
This error occurs if your final design matric contains non-numeric columns. For example, if you simply run X = data.drop(columns = ["Log Sale Price", "Sale Price"]), all the non-numeric columns of data are still included in X and you will see this error message. The fit function of a lm.LinearRegression object can take a pandas DataFrame as the X argument, but requires that the DataFrame is only composed of numeric values.
ValueError: Input X contains infinity or a value too large for dtype('float64')
The reason why your X data contains infinity is likely because you are taking the logarithm of 0 somewhere in your code. To prevent this, try:
- Adding a small number to the features that you want to perform the log transformation on so that all values are positive and greater than 0. Note that whatever value you add to your train data should also be added to your test data.
- Removing zeroes before taking the logarithm. Note that this is only possible on the training data as you cannot drop rows from the test set.
ValueError: Input X contains NaN
The reason why your design matrix X contains NaN values is likely because you take the log of a negative number somewhere in your code. To prevent this, try:
- Shifting the range of values for features that you want to perform the logging operation on to positive values greater than 0. Note that whatever value you add to your train data should also be added to your test data.
- Removing negative values before taking the log. Note that this is only possible on the training data as you cannot drop rows from the test set.
ValueError: The feature names should match those that were passed during fit
This error is followed by one or both of the following:
Feature names unseen at fit time:
- FEATURE NAME 1
- FEATURE NAME 2
  ...

Feature names seen at fit time, yet now missing
- FEATURE NAME 1
- FEATURE NAME 2
  ...
This error occurs if the columns/features you’re passing in for the test dataset aren’t the same as the features you used to train the model. sklearn’s models expect the testing data’s column names to match the training data’s. The features listed under Feature names unseen at fit time are columns that were present in the training data but not the testing data, and features listed under Feature names seen at fit time, yet now missing were present in the testing data but not the training data.
Potential causes for this error:
Your preprocessing for
Xis different for training and testing. Double-check your code infeature_engine_final! Besides removing any references to'Sale Price'and code that would remove rows from the test set, your preprocessing should be the same.Some one-hot-encoded categories are present in training but not in testing (or vice versa). For example, let’s say that the feature
"Data100"has categories “A”, “B”, “C”, and “D”. If “A”, “B”, and “C” are present in the training data, but “B”, “C”, and “D” are present in the testing data, you will get this error:The feature names should match those that were passed during fit. Feature names unseen at fit time: - Data100_D ... Feature names seen at fit time, yet now missing - Data100_A
ValueError: operands could not be broadcast together with shapes ...
This error occurs when you attempt to perform an operation on two NumPy arrays with mismatched dimensions. For example, np.ones(100000) - np.ones(1000000) is not defined since you cannot perform elementwise addition on arrays with different lengths. Use the error traceback to identify which line is erroring, and print out the shape of the arrays on the line before using .shape.
TypeError: NoneType is not subscriptable
This error occurs when a NoneType variable is being accessed like a class, for example None.some_function(). It may be difficult to identify where the NoneType is coming from, but here are some possible causes:
- Check that your helper functions always end with a
returnstatement and that the result is expected! pandas’inplace=argument allows us to simplify code; instead of reassigningdf = df.an_operation(inplace=False), you can choose to shorten the operation asdf.an_operation(inplace=True). Note that anyinplace=Trueargument modifies theDataFrameand returns nothing (read more about it in this stack overflow post). Bothdf = df.an_operation(inplace=True)anddf.an_operation(inplace=True).another_operation()will result in thisTypeError.
Check the return type of all functions you end up using. For example, np.append(arr_1, arr_2) returns a NumPy array. In contrast, Python’s .append function mutates the iterable and returns None. If you are unsure of what data type is being returned, looking up the documentation of the function , adding print statements, using type(some_function(input) are all useful ways to debug your code.
Question 6
I’m getting negative values for the prop_overest plot
Note that in the function body, the skeleton code includes:
# DO NOT MODIFY THESE TWO LINES
    if subset_df.shape[0] == 0:
        return -1
The above two lines of code are included to avoid dividing by 0 when computing prop_overest in the case that subset_df does not have any rows. When interpreting the plots, you can disregard the negative portions as you know they are invalid values corresponding to this edge case. You can verify this by observing that your RMSE plot does not display the corresponding intervals.
Gradescope/Pensieve
I don’t have many Gradescope/Pensieve submissions left
If you’re almost out of Gradescope submissions, try using k-fold cross-validation to check the accuracy of your model. Results from cross-validation will be closer to the test set accuracy than results from the training data. Feel free to take a look at the code used in Lecture 16 if you’re confused on how to implement cross-validation.
“Wrong number of lines ( ** instead of ** )”
This occurs when you remove outliers when preprocessing the testing data. Please do not remove any outliers from your test set. You may only remove outliers in training data.