Diversity and Data Science:
Unfortunately, surveys of data scientists suggest that there are far fewer women in data science:
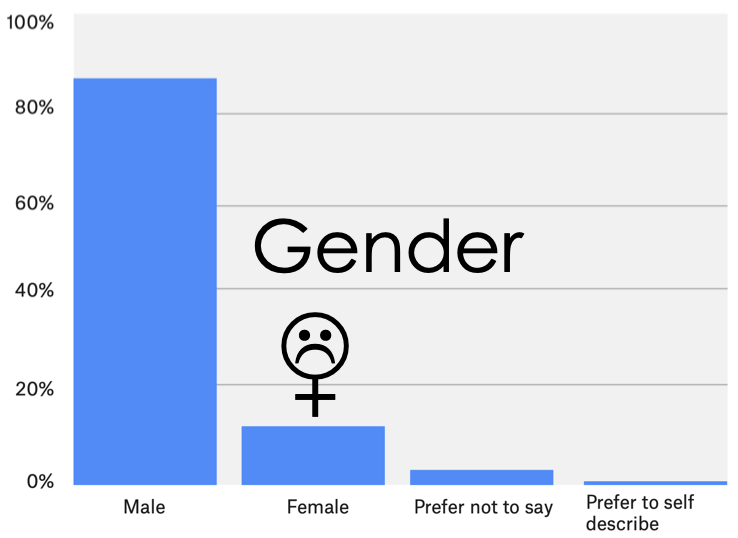
To learn more checkout the Kaggle Executive Summary or study the Raw Data.
by Raguvir Kunani, Isaac Schmidt
adapted from Joseph Gonzalez, Anthony D. Joseph, Josh Hug, Suraj Rampure
import pandas as pd
import numpy as np
np.random.seed(24)

## Plotly plotting support
import plotly.offline as py
py.init_notebook_mode()
import plotly.graph_objs as go
import plotly.figure_factory as ff
import plotly.express as px
/opt/conda/lib/python3.8/site-packages/geopandas/_compat.py:106: UserWarning:

The Shapely GEOS version (3.8.0-CAPI-1.13.1 ) is incompatible with the GEOS version PyGEOS was compiled with (3.9.1-CAPI-1.14.2). Conversions between both will be slow.
names = pd.read_csv("data/names.csv")
majors = pd.read_csv("data/majors.csv")
names.head()
| name | |
|---|---|
| 0 | MaiLinh |
| 1 | Neel |
| 2 | Ray |
| 3 | Daniel |
| 4 | Rachel |
# names.sample(10)
names.iloc[337]
name    ZIYAN
Name: 337, dtype: object
names["name"] = names["name"].str.lower()
names.head()
| name | |
|---|---|
| 0 | mailinh |
| 1 | neel |
| 2 | ray |
| 3 | daniel |
| 4 | rachel |
majors.head(20)
| Majors | Terms in Attendance | |
|---|---|---|
| 0 | Computer Science BA | 7 |
| 1 | Chemical Biology BS | 8 |
| 2 | Mathematics BA | 8 |
| 3 | Computer Science BA | 8 |
| 4 | Applied Mathematics BA | 7 |
| 5 | Cognitive Science BA | 7 |
| 6 | Physics BA | 8 |
| 7 | Astrophysics BA, Computer Science BA | 8 |
| 8 | Molecular & Cell Biology BA, Spanish and Portu... | 8 |
| 9 | Physics BA | 7 |
| 10 | Chemical Engineering BS, Letters & Sci Undecla... | 7 |
| 11 | Summer Domestic Visitor UG | U |
| 12 | Computer Science BA | 8 |
| 13 | Summer Domestic Visitor UG | U |
| 14 | Letters & Sci Undeclared UG | 8 |
| 15 | Computer Science BA | 7 |
| 16 | Business Administration BS, Data Science BA, L... | 8 |
| 17 | Electrical Eng & Comp Sci BS | 8 |
| 18 | Electrical Eng & Comp Sci BS | 7 |
| 19 | Bioengineering BS, Elec Eng & Comp Sci 5th Yr ... | 8 |
names.describe()
| name | |
|---|---|
| count | 379 |
| unique | 326 |
| top | ryan |
| freq | 6 |
majors.describe()
| Majors | Terms in Attendance | |
|---|---|---|
| count | 379 | 379 |
| unique | 78 | 9 |
| top | Letters & Sci Undeclared UG | 5 |
| freq | 74 | 143 |
What are the top majors:
majors["Majors"].value_counts().head(20)
Letters & Sci Undeclared UG                    74
Computer Science BA                            45
Data Science BA                                33
Electrical Eng & Comp Sci BS                   22
Economics BA                                   22
Cognitive Science BA                           15
Chemical Engineering BS                        13
Civil Engineering BS                           12
Summer Internatnl Visitor UG                   12
Molecular & Cell Biology BA                     9
Applied Mathematics BA                          7
Summer Domestic Visitor UG                      7
Industrial Eng & Ops Rsch BS                    6
Materials Science & Eng BS                      6
Business Administration BS                      5
Statistics BA                                   4
Physics BA                                      4
Applied Mathematics BA, Computer Science BA     4
Chemical Biology BS                             3
Bioengineering BS                               3
Name: Majors, dtype: int64
fig = px.bar(majors["Majors"].value_counts().sort_values().tail(20),
             orientation="h")
fig.update_layout(dict(showlegend=False, xaxis_title="Count", yaxis_title="Major"))
fig = px.bar(majors["Terms in Attendance"].value_counts())
fig.update_layout(xaxis_title="Term", yaxis_title="Count", showlegend=False)
Unfortunately, surveys of data scientists suggest that there are far fewer women in data science:
To learn more checkout the Kaggle Executive Summary or study the Raw Data.
This is an important question to keep in mind as we try to improve the data science program at Berkeley.
This is actually a fairly complex question. What do we mean by female? Is this a question about the sex or gender identity of the students? They are not the same thing.
The goal is to improve gender diversity by ensuring that Berkeley's data science program is inclusive.
print(majors.columns)
print(names.columns)
Index(['Majors', 'Terms in Attendance'], dtype='object')
Index(['name'], dtype='object')
What I am about to do is flawed in so many ways and we will discuss these flaws in a moment and throughout the semester. However, it will illustrate some very basic inferential modeling and how we might combine multiple data sources to try and reason about something we haven't measured.
In Data 100 you will have to learn about different data sources (and their limitations) on your own.
Reading from SSN Office description:
All names are from Social Security card applications for births that occurred in the United States after 1879. Note that many people born before 1937 never applied for a Social Security card, so their names are not included in our data. For others who did apply, our records may not show the place of birth, and again their names are not included in our data.
To safeguard privacy, we exclude from our tabulated lists of names those that would indicate, or would allow the ability to determine, names with fewer than 5 occurrences in any geographic area. If a name has less than 5 occurrences for a year of birth in any state, the sum of the state counts for that year will be less than the national count.
All data are from a 100% sample of our records on Social Security card applications as of March 2020.
import urllib.request
import os.path

# Download data from the web directly
data_url = "https://www.ssa.gov/oact/babynames/names.zip"
local_filename = "babynames.zip"
if not os.path.exists(local_filename): # if the data exists don't download again
    with urllib.request.urlopen(data_url) as resp, open(local_filename, 'wb') as f:
        f.write(resp.read())


# Load data without unzipping the file
import zipfile
babynames = []
with zipfile.ZipFile(local_filename, "r") as zf:
    data_files = [f for f in zf.filelist if f.filename[-3:] == "txt"]
    def extract_year_from_filename(fn):
        return int(fn[3:7])
    for f in data_files:
        year = extract_year_from_filename(f.filename)
        with zf.open(f) as fp:
            df = pd.read_csv(fp, names=["Name", "Sex", "Count"])
            df["Year"] = year
            babynames.append(df)
babynames = pd.concat(babynames)


babynames.head()
| Name | Sex | Count | Year | |
|---|---|---|---|---|
| 0 | Mary | F | 7065 | 1880 |
| 1 | Anna | F | 2604 | 1880 |
| 2 | Emma | F | 2003 | 1880 |
| 3 | Elizabeth | F | 1939 | 1880 |
| 4 | Minnie | F | 1746 | 1880 |
A little bit of data cleaning (to be consistent with how we formatted student names):
babynames['Name'] = babynames['Name'].str.lower()
babynames.head()
| Name | Sex | Count | Year | |
|---|---|---|---|---|
| 0 | mary | F | 7065 | 1880 |
| 1 | anna | F | 2604 | 1880 |
| 2 | emma | F | 2003 | 1880 |
| 3 | elizabeth | F | 1939 | 1880 |
| 4 | minnie | F | 1746 | 1880 |
How many people does this data represent?
format(babynames['Count'].sum(), ',d') # total number of babies represented
'358,480,709'
format(babynames.shape[0], ',d') # total number of names represented
'2,020,863'
Trying a simple query:
babynames[(babynames['Name'] == 'isaac') & (babynames['Year'] == 1999)]
| Name | Sex | Count | Year | |
|---|---|---|---|---|
| 6015 | isaac | F | 17 | 1999 |
| 17007 | isaac | M | 6405 | 1999 |
Let's use this data to estimate the fraction of female students in the class.
In this example we construct a pivot table which aggregates the number of babies registered for each year by Sex.
year_sex = pd.pivot_table(babynames,
        index=['Year'], # the row index
        columns=['Sex'], # the column values
        values='Count', # the field(s) to processed in each group
        aggfunc=np.sum,
    )

year_sex.head()
| Sex | F | M |
|---|---|---|
| Year | ||
| 1880 | 90994 | 110490 |
| 1881 | 91953 | 100738 |
| 1882 | 107847 | 113686 |
| 1883 | 112319 | 104625 |
| 1884 | 129019 | 114442 |
px.line(year_sex)
year_sex_unique = pd.pivot_table(babynames,
        index=['Year'],
        columns=['Sex'],
        values='Name',
        aggfunc=lambda x: len(np.unique(x)),
    )
px.line(year_sex_unique)
Some observations:
name_sex = pd.pivot_table(babynames, index='Name', columns='Sex', values='Count',
                            aggfunc='sum', fill_value=0., margins=True)
name_sex.head()
| Sex | F | M | All |
|---|---|---|---|
| Name | |||
| aaban | 0 | 120 | 120 |
| aabha | 46 | 0 | 46 |
| aabid | 0 | 16 | 16 |
| aabidah | 5 | 0 | 5 |
| aabir | 0 | 10 | 10 |
Compute proportion of female babies given each name.
prop_female = (name_sex['F'] / name_sex['All']).rename("Prop. Female")
prop_female.head(10)
Name
aaban        0.0
aabha        1.0
aabid        0.0
aabidah      1.0
aabir        0.0
aabriella    1.0
aada         1.0
aadam        0.0
aadan        0.0
aadarsh      0.0
Name: Prop. Female, dtype: float64
prop_female['joey']
0.1151411838174484
prop_female['isaac']
0.002527827840211856
prop_female['avery']
0.7021478300997172
We can define a function to return the most likely Sex for a name. If there is an exact tie or the name does not appear in the social security dataset the function returns Unknown.
def sex_from_name(name):
    lower_name = name.lower()
    if lower_name not in prop_female.index or prop_female[lower_name] == 0.5:
        return "Unknown"
    elif prop_female[lower_name] > 0.5:
        return "F"
    else:
        return "M"
sex_from_name("isaac")
'M'
sex_from_name("avery")
'F'
names['Pred. Sex'] = names['name'].apply(sex_from_name)
px.bar(names['Pred. Sex'].value_counts()/len(names))
print("Fraction of names in the babynames data:",
      names["name"].isin(prop_female.index).mean())
Fraction of names in the babynames data: 0.8443271767810027
Why might these names not appear?
names[~names["name"].isin(prop_female.index)]
| name | Pred. Sex | |
|---|---|---|
| 10 | juchan | Unknown |
| 26 | prasuna | Unknown |
| 30 | sungjoo | Unknown |
| 38 | yunhai | Unknown |
| 40 | guang | Unknown |
| 41 | jihong | Unknown |
| 47 | diyah | Unknown |
| 50 | ja(thanakul) | Unknown |
| 55 | wenjie | Unknown |
| 63 | liming | Unknown |
| 64 | mridang | Unknown |
| 66 | baljinder | Unknown |
| 71 | anukta | Unknown |
| 78 | junyang | Unknown |
| 83 | jiaji | Unknown |
| 95 | howon | Unknown |
| 98 | seongyun | Unknown |
| 99 | weici | Unknown |
| 120 | chengyuan | Unknown |
| 122 | mengziang | Unknown |
| 138 | jaehyun | Unknown |
| 144 | fang | Unknown |
| 145 | ho-yen | Unknown |
| 146 | xiaowen | Unknown |
| 152 | smruthi | Unknown |
| 153 | wenli | Unknown |
| 173 | haijing | Unknown |
| 174 | gyuhyeon | Unknown |
| 182 | jiazhi | Unknown |
| 189 | aska | Unknown |
| 190 | jungwon | Unknown |
| 194 | simmarjot | Unknown |
| 195 | nathalys | Unknown |
| 201 | basiq | Unknown |
| 207 | ruirui | Unknown |
| 216 | yinong | Unknown |
| 228 | pragnay | Unknown |
| 229 | chenyuan | Unknown |
| 245 | edrea | Unknown |
| 264 | kehan(jason) | Unknown |
| 266 | sangwook | Unknown |
| 268 | xiaochen | Unknown |
| 269 | jelovus | Unknown |
| 273 | xingze | Unknown |
| 280 | lixiang | Unknown |
| 292 | joycerocelle | Unknown |
| 297 | kidong | Unknown |
| 299 | yaoming | Unknown |
| 301 | xiangyu | Unknown |
| 310 | i-jung | Unknown |
| 321 | minghui | Unknown |
| 325 | hongxian | Unknown |
| 333 | ardalan | Unknown |
| 334 | pratiyush | Unknown |
| 347 | yukai | Unknown |
| 351 | sudhit | Unknown |
| 362 | yunhao | Unknown |
| 370 | gamin | Unknown |
| 371 | xuejing | Unknown |
Previously we treated a name which is given to females 40% of the time as a "Male" name. This doesn't capture our uncertainty. We can use simulation to provide a better distributional estimate.
names["Prop. Female"] = (
    names[["name"]].merge(prop_female, how='left', left_on="name",
                          right_index=True)["Prop. Female"]
        .fillna(0.5)
)
names.head(10)
| name | Pred. Sex | Prop. Female | |
|---|---|---|---|
| 0 | mailinh | F | 1.000000 |
| 1 | neel | M | 0.000000 |
| 2 | ray | M | 0.026258 |
| 3 | daniel | M | 0.004218 |
| 4 | rachel | F | 0.996854 |
| 5 | sasha | F | 0.960328 |
| 6 | wei | M | 0.218232 |
| 7 | janice | F | 0.997156 |
| 8 | sarah | F | 0.996934 |
| 9 | jasper | M | 0.018834 |
# Example of 1 simulation
names['Sim. Female'] = names['Prop. Female'] > np.random.rand(len(names))
names.tail(20)
| name | Pred. Sex | Prop. Female | Sim. Female | |
|---|---|---|---|---|
| 359 | liane | F | 1.000000 | True |
| 360 | ege | M | 0.000000 | False |
| 361 | yash | M | 0.000000 | False |
| 362 | yunhao | Unknown | 0.500000 | True |
| 363 | kevin | M | 0.004517 | False |
| 364 | kevin | M | 0.004517 | False |
| 365 | paul | M | 0.004182 | False |
| 366 | lavanya | F | 1.000000 | True |
| 367 | stephan | M | 0.008377 | False |
| 368 | hiroshi | M | 0.000000 | False |
| 369 | alex | M | 0.032375 | False |
| 370 | gamin | Unknown | 0.500000 | False |
| 371 | xuejing | Unknown | 0.500000 | True |
| 372 | lauren | F | 0.987842 | True |
| 373 | lukas | M | 0.000514 | False |
| 374 | bowie | M | 0.353330 | False |
| 375 | omotara | F | 1.000000 | True |
| 376 | aishwarya | F | 1.000000 | True |
| 377 | dennis | M | 0.004300 | False |
| 378 | david | M | 0.003540 | False |
# function that performs many simulations
def simulate_class(names):
    is_female = names['Prop. Female'] > np.random.rand(len(names['Prop. Female']))
    return np.mean(is_female)    # proportion of females for entire class

sim_frac_female = np.array([simulate_class(names) for n in range(10000)])
ff.create_distplot([sim_frac_female], ['Fraction Female'], bin_size=0.0025, show_rug=False)